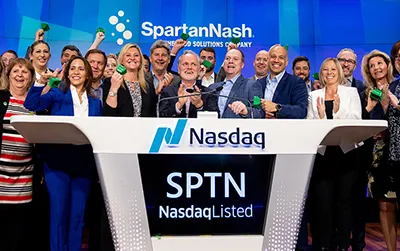
SpartanNash Foundation and Junior Achievement Celebrate Successful Back-to-School Fundraiser


Donation of $150,000 from community members and SpartanNash Foundation bolster education and youth development initiatives throughout the Midwest

GRAND RAPIDS, Mich., Sept. 21, 2023 /PRNewswire/ — Food solutions company SpartanNash (“SpartanNash”) (Nasdaq: SPTN) and the SpartanNash Foundation are proud to announce the success of their in-store fundraiser in collaboration with Junior Achievement (“JA”), a nonprofit dedicated to empowering young minds.

The in-store campaign raised $150,000 for JA, supporting the expansion of educational curriculums, fostering in-school programming, and providing valuable volunteer resources. In addition to this initiative, Junior Achievement recently teamed up with SpartanNash and the Food Industry Association to develop programs that inspire students to explore career paths in the food industry.

“We’re proud of our partnership with Junior Achievement and thankful for the ongoing support from our store Associates and local communities,” said SpartanNash Senior Vice President of Communications and SpartanNash Foundation Executive Director Adrienne Chance, who serves on the Board of Directors for Junior Achievement of Michigan Great Lakes. “Together, we have teamed up to make a significant impact on the lives of countless young individuals, imparting financial literacy and delivering the ingredients for a better life along the way.”

The fundraiser, which ran from Aug. 23 to Sept. 4, received a positive response from communities across the region. Donations were made at participating SpartanNash-operated retail stores, including Family Fare, Martin’s Super Markets, D&W Fresh Market and fuel centers. To support JA’s mission, store guests had the opportunity to contribute a dollar amount of their choosing or round up their total to the nearest dollar at checkout. After donating, store guests signed their name on a donation card, which was posted on the wall of their local store. Online donations were also made accessible through the SpartanNash Fast Lane.

“We are grateful SpartanNash sees value in our programming and chose to kick off this school year by supporting students across the Midwest,” said Junior Achievement of Michigan Great Lakes President and CEO Bill Coderre. “SpartanNash’s support in the Junior Achievement programming will allow students to gain the skills and economic understanding to be confident and successful adults in their respective communities while raising their awareness and interest about careers in the food industry.”

To learn more about the SpartanNash Foundation, please visit SpartanNash.com/foundation.

About SpartanNash
SpartanNash (Nasdaq: SPTN) is a food solutions company that delivers the ingredients for a better life. Committed to fostering a People First culture, the SpartanNash family of Associates is 17,500 and growing. SpartanNash operates two complementary business segments – food wholesale and grocery retail. Its global supply chain network serves wholesale customers that include independent and chain grocers, national retail brands, e-commerce platforms, and U.S. military commissaries and exchanges. The Company distributes products for every aisle in the grocery store, from fresh produce to household goods to its OwnBrands, which include the Our Family® portfolio of products. On the retail side, SpartanNash operates 144 brick-and-mortar grocery stores, primarily under the banners of Family Fare, Martin’s Super Markets and D&W Fresh Market, in addition to dozens of pharmacies and fuel centers. Leveraging insights and solutions across its segments, SpartanNash offers a full suite of support services for independent grocers. For more information, visit spartannash.com.

CONTACT:
Adrienne Chance
SVP, Communications
SpartanNash
[email protected]

Cision View original content to download multimedia:https://www.prnewswire.com/news-releases/spartannash-foundation-and-junior-achievement-celebrate-successful-back-to-school-fundraiser-301934814.html

SOURCE SpartanNash

SpartanNash Promotes Bennett Morgan to EVP, Chief Merchandising Officer


Morgan’s role is elevated as the food solutions company realizes benefits from its merchandising transformation

GRAND RAPIDS, Mich., Sept. 6, 2023 /PRNewswire/ — Food solutions company SpartanNash (the “Company”) (Nasdaq: SPTN) today announced the promotion of Bennett Morgan to Executive Vice President, Chief Merchandising Officer. Morgan joined SpartanNash in January 2022 as Senior Vice President, Chief Merchandising Officer. He leads fresh, center store and pharmacy merchandising, category management, pricing, promotions and master data management.

“Bennett’s leadership has advanced our capabilities in Merchandising and accelerated the benefits we are realizing from our transformation work,” said SpartanNash CEO Tony Sarsam. “Merchandising continues to play a critical role in our store guest experience, and we are leveraging those insights to help our independent grocery customers grow their businesses.”

Morgan’s promotion follows the announcement of two newly appointed Merchandising leaders at SpartanNash – Arpen Shah as Vice President, Merchandising Strategy and Analytics, and Brandon Pasch as Vice President, Center Store Merchandising. These organizational investments reflect the Company’s continued commitment to its merchandising transformation, which leverages key insights to drive enhanced category planning, promotional effectiveness and a more compelling customer offer.

Prior to SpartanNash, Morgan worked at Amazon, where he helped launch its fast-growing omni-channel grocery business, including opening its first physical grocery stores across the country. He served as Amazon Fresh Category Leader overseeing fresh as well as center store merchandising in different capacities over time.

Prior to Amazon, Morgan served as Vice President, Merchandising for Walmart China and Japan, managing all non-buying portions of the merchandising organization. His key focus areas included cost negotiations and advanced data-led capabilities in assortment, pricing and promotions. He also spent several years of his career at H-E-B leading lean store operations, supply chain, manufacturing and merchandising efforts. Prior to H-E-B, he worked at Boston Consulting Group and Citibank.

Morgan earned his undergraduate degree in economics from the University of Texas at Austin and his Master of Business Administration from Dartmouth College.

About SpartanNash
SpartanNash (Nasdaq: SPTN) is a food solutions company that delivers the ingredients for a better life. Committed to fostering a People First culture, the SpartanNash family of Associates is 17,500 and growing. SpartanNash operates two complementary business segments – food wholesale and grocery retail. Its global supply chain network serves wholesale customers that include independent and chain grocers, national retail brands, e-commerce platforms, and U.S. military commissaries and exchanges. The Company distributes products for every aisle in the grocery store, from fresh produce to household goods to its OwnBrands, which include the Our Family® portfolio of products. On the retail side, SpartanNash operates 144 brick-and-mortar grocery stores, primarily under the banners of Family Fare, Martin’s Super Markets and D&W Fresh Market, in addition to dozens of pharmacies and fuel centers. Leveraging insights and solutions across its segments, SpartanNash offers a full suite of support services for independent grocers. For more information, visit spartannash.com.

CONTACT:
Adrienne Chance
SVP, Communications
SpartanNash
[email protected]

Cision View original content to download multimedia:https://www.prnewswire.com/news-releases/spartannash-promotes-bennett-morgan-to-evp-chief-merchandising-officer-301918276.html

SOURCE SpartanNash

SpartanNash Leveraging AI Technology to Predict Shopper Demand, Decrease Waste


The Company partnered with Upshop to leverage its Magictool to optimize localized inventory, bolster efficient merchandising strategies and improve sustainability

GRAND RAPIDS, Mich., Sept. 5, 2023 /PRNewswire/ — Food solutions company SpartanNash (the “Company”) (Nasdaq: SPTN) is expanding its use of Upshop’s Magic™ inventory and replenishment optimization application, to consolidate its ordering systems, maintain planogram integrity and assist with merchandising reset planning in both the center store and the produce department. The system also provides store Associates with a real-time, comprehensive view of the store’s stock to maximize assortment for guests, while at the same time reducing waste.

“At SpartanNash, we’re prioritizing technology to enhance our Associate and store guest experience,” said SpartanNash Executive Vice President, Corporate Retail Tom Swanson. “By leveraging advanced analytics to predict product demand, our Associates can spend less time checking inventory and more time face-to-face helping serve our shoppers.”

The Magic application is specifically designed for the grocery industry, reviewing seasonal trends, promotional activity, display allocation and real-time sales data to offer actionable insights that enhance inventory accuracy and guest satisfaction.

“As a leader in forecast and ordering solutions, Upshop is excited to partner with innovative grocery retailers such as SpartanNash to offer the tools they need to optimize their inventory to meet total store demand,” said Upshop CEO Shamus Hines. “We’re confident this expanded solution will provide an exceptional shopping experience for store guests by ensuring shelves are always stocked with delicious, fresh options.”

This tool builds on SpartanNash’s ongoing investments in technology to reflect the Company’s commitment to its merchandising and supply chain transformations, leading to a better customer experience and cost savings. The food solutions Company recently announced expansion plans for the use of an autonomous inventory robot providing real-time data intelligence.

“We’re proud to continue to demonstrate how AI technology can improve operational excellence in our stores and across our business network,” said SpartanNash Executive Vice President and Chief Strategy and Information Officer Masiar Tayebi. “Improving our inventory control and accuracy accelerates the financial benefits we can realize from our merchandising and supply chain transformations.”

For more information about SpartanNash, please visit spartannash.com.

About SpartanNash
SpartanNash (Nasdaq: SPTN) is a food solutions company that delivers the ingredients for a better life. Committed to fostering a People First culture, the SpartanNash family of Associates is 17,500 and growing. SpartanNash operates two complementary business segments – food wholesale and grocery retail. Its global supply chain network serves wholesale customers that include independent and chain grocers, national retail brands, e-commerce platforms, and U.S. military commissaries and exchanges. The Company distributes products for every aisle in the grocery store, from fresh produce to household goods to its OwnBrands, which include the Our Family® portfolio of products. On the retail side, SpartanNash operates 144 brick-and-mortar grocery stores, primarily under the banners of Family Fare, Martin’s Super Markets and D&W Fresh Market, in addition to dozens of pharmacies and fuel centers. Leveraging insights and solutions across its segments, SpartanNash offers a full suite of support services for independent grocers. For more information, visit spartannash.com.

CONTACT:
Adrienne Chance
SVP, Communications
SpartanNash
[email protected]

Cision View original content to download multimedia:https://www.prnewswire.com/news-releases/spartannash-leveraging-ai-technology-to-predict-shopper-demand-decrease-waste-301918073.html

SOURCE SpartanNash

SpartanNash Promotes Derek Tufts to Vice President, Human Resources


As the food solutions company’s People First culture advances, Tufts now leads business-facing HR strategy and execution

GRAND RAPIDS, Mich., Aug. 28, 2023 /PRNewswire/ — Food solutions company SpartanNash (the “Company”) (Nasdaq: SPTN) today announced the promotion of Derek Tufts to Vice President, Human Resources. Tufts was hired in 2019 as Director, Human Resources for the Retail segment, and he was promoted to Senior Director, Human Resources of Corporate and Retail in 2022. Tufts will play a key role in coaching senior leaders and developing HR Business Partners to advance the Company’s People First culture, supporting 17,500 Associates.

“Derek has played a vital leadership role in ensuring the HR strategy and practices align to our People First culture, and we’re proud to promote from within to extend his expertise to positively impact our Associate experience across the company,” said SpartanNash Senior Vice President, Chief Human Resources Officer Nicole Zube.

During his tenure at SpartanNash, Tufts played a critical role in keeping the Company’s retail stores open and safe during the pandemic. He was an integral part of various M&A integrations and led a project team to update the Company’s Associate relations process. He is also a trusted coach and advisor to many Associates and leaders.

In his expanded role, Tufts will focus on developing and training Human Resources Business Partners; driving retention and reducing turnover; partnering with the centers of excellence in HR; and improving overall HR business-facing operations.

Tufts brings over 25 years of extensive human resources experience in employee relations, development and retention for global retailers including Toys “R” Us, OfficeMax and local company Art Van Furniture. He earned his undergraduate degree from Eastern Michigan University and currently resides in Grand Rapids, Mich. with his family.

About SpartanNash
SpartanNash (Nasdaq: SPTN) is a food solutions company that delivers the ingredients for a better life. Committed to fostering a People First culture, the SpartanNash family of Associates is 17,500 and growing. SpartanNash operates two complementary business segments – food wholesale and grocery retail. Its global supply chain network serves wholesale customers that include independent and chain grocers, national retail brands, e-commerce platforms, and U.S. military commissaries and exchanges. The Company distributes products for every aisle in the grocery store, from fresh produce to household goods to its OwnBrands, which include the Our Family® portfolio of products. On the retail side, SpartanNash operates 144 brick-and-mortar grocery stores, primarily under the banners of Family Fare, Martin’s Super Markets and D&W Fresh Market, in addition to dozens of pharmacies and fuel centers. Leveraging insights and solutions across its segments, SpartanNash offers a full suite of support services for independent grocers. For more information, visit spartannash.com.

CONTACT:
Adrienne Chance
SVP, Communications
SpartanNash
[email protected]

Cision View original content to download multimedia:https://www.prnewswire.com/news-releases/spartannash-promotes-derek-tufts-to-vice-president-human-resources-301911523.html

SOURCE SpartanNash

SpartanNash Refreshes Board with Appointment of New Independent Director


Kerrie MacPherson enhances SpartanNash Board of Directors with extensive financial services and audit experience

GRAND RAPIDS, Mich. , Aug. 23, 2023 /PRNewswire/ — Food solutions company SpartanNash (the “Company”) (Nasdaq: SPTN) today announced the appointment of Kerrie D. MacPherson to the Board of Directors (the “Board”), effective immediately. As an independent director, MacPherson will serve on the Audit Committee.

MacPherson brings more than three decades of international business experience working with senior management and boards to drive growth and innovation while efficiently scaling services to the market. She began her career as an auditor and spent 32 years at Ernst & Young LLP (EY) in various Americas and global leadership roles in M&A, advisory and sales and marketing.

In addition to the SpartanNash Board, MacPherson serves as independent director for Community Bank System, Inc. She is Chair of the Audit Committee; a member of the Risk and Compliance Committee; a member of the Trust and Financial Services Committee; as well as a Board Liaison to the Employee Culture and Diversity Council. MacPherson also serves on the Board of Directors of the privately held Synechron Holdings Inc., where she is Chair of the Audit Committee and a member of the Nominating and Corporate Governance Committee. In 2020, Directors and Boards magazine named MacPherson a “Director to Watch.”

MacPherson earned her undergraduate degree in commerce and her Master of Business Administration from the University of Toronto. She is a Fellow of the Chartered Professional Accountants of Ontario, the organization’s highest distinction. MacPherson has been a longstanding champion of diversity and inclusion, having sponsored and co-instructed a leading program for high-potential female leaders called Power.Presence.Purpose. MacPherson also served as Executive Sponsor for EY Entrepreneurial Winning Women, a leadership program to assist female entrepreneurs in growing their businesses.

“We are proud to welcome such an accomplished leader as Kerrie to the SpartanNash Board. Her deep financial services and audit expertise will benefit the Board and management team as we work to accelerate the value we are creating for our shareholders, SpartanNash Associates, customers and suppliers,” said SpartanNash Board of Directors Chairman Douglas Hacker. “Looking to the future, we will remain diligent about ongoing Board refreshment to ensure our directors continue to offer the right combination of skills, experience and diversity.”

SpartanNash last refreshed its Board in 2022 with the addition of three independent directors who replaced three directors who did not seek reelection. With the addition of MacPherson, the Board now comprises nine directors – five of whom have been appointed in the last five years – and eight of whom are independent.

About SpartanNash
SpartanNash (Nasdaq: SPTN) is a food solutions company that delivers the ingredients for a better life. Committed to fostering a People First culture, the SpartanNash family of Associates is 17,500 and growing. SpartanNash operates two complementary business segments – food wholesale and grocery retail. Its global supply chain network serves wholesale customers that include independent and chain grocers, national retail brands, e-commerce platforms, and U.S. military commissaries and exchanges. The Company distributes products for every aisle in the grocery store, from fresh produce to household goods to its OwnBrands, which include the Our Family® portfolio of products. On the retail side, SpartanNash operates 144 brick-and-mortar grocery stores, primarily under the banners of Family Fare, Martin’s Super Markets and D&W Fresh Market, in addition to dozens of pharmacies and fuel centers. Leveraging insights and solutions across its segments, SpartanNash offers a full suite of support services for independent grocers. For more information, visit spartannash.com.

MEDIA CONTACT:
Adrienne Chance
SVP, Communications
[email protected]

INVESTOR CONTACT:
Kayleigh Campbell
Head of Investor Relations
[email protected]

Cision View original content to download multimedia:https://www.prnewswire.com/news-releases/spartannash-refreshes-board-with-appointment-of-new-independent-director-301908381.html

SOURCE SpartanNash

SpartanNash Foundation Teams Up with Junior Achievement for Back-to-School In-Store Fundraiser


Donations made starting today through Sept. 3 will support education and youth development initiatives across the Midwest

GRAND RAPIDS, Mich., Aug. 23, 2023 /PRNewswire/ — With back-to-school season underway, food solutions company SpartanNash (the “Company”) (Nasdaq: SPTN) launched an in-store fundraiser through the SpartanNash Foundation, benefiting youth education nonprofit Junior Achievement (JA).

JA’s mission is “to inspire and prepare young people to succeed in a global economy.” The organization recently teamed up with SpartanNash and the Food Industry Association to develop programs that inspire students to explore career paths in the food industry. JA helps students learn about financial literacy, work readiness and entrepreneurship through engaging, hands-on educational programs. Proceeds from this fundraiser will go toward expanding educational curriculums, including in-school programming and volunteer resources.

“The SpartanNash Foundation strives to provide our communities with hope for a better future, and we are proud to support education and nurture the career aspirations of tomorrow’s leaders,” said SpartanNash Senior Vice President of Communications and SpartanNash Foundation Executive Director Adrienne Chance, who was recently appointed to serve on the Board of Directors for JA of Michigan Great Lakes. “Our partnership with Junior Achievement signifies more than just imparting financial literacy and educational resources; it’s about inspiring a vibrant community of youth to help them make informed decisions into adulthood.”

Store guests can donate at participating SpartanNash-operated retail stores, including Family Fare, Martin’s Super Markets, D&W Fresh Market and fuel centers. Between today and Sept. 3, donations of $1, $5 or $10 will be accepted at checkout, with the option to round up totals to the nearest dollar to support JA. Online donations are also possible through Fast Lane.

“We are thrilled to embark on this journey with SpartanNash, an organization sharing our passion for empowering young individuals,” said Junior Achievement of Michigan Great Lakes President and CEO Bill Coderre. “We passionately believe students who engage with JA programming gain a profound grasp of economic dynamics, thus equipping them to navigate future choices with unwavering confidence. We are grateful to form a meaningful partnership with SpartanNash enabling us to extend this vital mission among the young minds who shape our communities.”

To learn more about the SpartanNash Foundation and its impact, visit spartannash.com/foundation.

About SpartanNash
SpartanNash (Nasdaq: SPTN) is a food solutions company that delivers the ingredients for a better life. Committed to fostering a People First culture, the SpartanNash family of Associates is 17,500 and growing. SpartanNash operates two complementary business segments – food wholesale and grocery retail. Its global supply chain network serves wholesale customers that include independent and chain grocers, national retail brands, e-commerce platforms, and U.S. military commissaries and exchanges. The Company distributes products for every aisle in the grocery store, from fresh produce to household goods to its OwnBrands, which include the Our Family® portfolio of products. On the retail side, SpartanNash operates 144 brick-and-mortar grocery stores, primarily under the banners of Family Fare, Martin’s Super Markets and D&W Fresh Market, in addition to dozens of pharmacies and fuel centers. Leveraging insights and solutions across its segments, SpartanNash offers a full suite of support services for independent grocers. For more information, visit spartannash.com.

CONTACT:
Adrienne Chance
SVP, Communications
SpartanNash
[email protected]

Cision View original content to download multimedia:https://www.prnewswire.com/news-releases/spartannash-foundation-teams-up-with-junior-achievement-for-back-to-school-in-store-fundraiser-301907323.html

SOURCE SpartanNash

SpartanNash Donates to Disaster Relief Efforts in Maui


The food solutions company provided essential items and financial support to residents impacted by wildfires

GRAND RAPIDS, Mich., Aug. 21, 2023 /PRNewswire/ — Food solutions company SpartanNash (the “Company”) (Nasdaq: SPTN) donated two truckloads of food and bottled water to residents of Maui who were impacted by fast-moving wildfires. The company partnered with Convoy of Hope to ship products quickly and efficiently to Maui. In addition to its product donations, SpartanNash provided $25,000 in financial support to the Hawaii Community Foundation in collaboration with the American Logistics Association (ALA).

“The destruction and devastation caused by the wildfires in Maui is heartbreaking,” said SpartanNash CEO Tony Sarsam. “As a People First company, we are dedicated to committing time and resources to communities in need. SpartanNash is proud to work with Convoy of Hope and ALA to provide essential items and comfort for residents at this dire time.”

Since the beginning of August, wildfires burning on the Hawaiian island of Maui have displaced thousands of residents, caused widespread damage and resulted in many deaths in the town of Lāhainā. Convoy of Hope has deployed more than one hundred volunteers and many supplies to assist the community in the deadliest wildfires the U.S has seen in more than a century.

“We are grateful to once again work with SpartanNash to quickly distribute supplies to people in need,” said Convoy of Hope Vice President of Public Engagement Ethan Forhetz. “Communities in Maui need our support more than ever, and SpartanNash’s generous donation will help provide hope and care in these challenging times.”

The food solutions company is committed to leveraging its vast distribution network and food logistics expertise to provide aid when and where it is most needed. SpartanNash has recently provided critical disaster relief to California residents impacted by severe flooding, initiated donations for TurkeySyria earthquake survivors and completed $1M in aid to Ukrainian refugees.

For more information or to donate to Convoy of Hope, visit convoyofhope.org.

About SpartanNash
SpartanNash (Nasdaq: SPTN) is a food solutions company that delivers the ingredients for a better life. Committed to fostering a People First culture, the SpartanNash family of Associates is 17,500 and growing. SpartanNash operates two complementary business segments – food wholesale and grocery retail. Its global supply chain network serves wholesale customers that include independent and chain grocers, national retail brands, e-commerce platforms, and U.S. military commissaries and exchanges. The Company distributes products for every aisle in the grocery store, from fresh produce to household goods to its OwnBrands, which include the Our Family® portfolio of products. On the retail side, SpartanNash operates 144 brick-and-mortar grocery stores, primarily under the banners of Family Fare, Martin’s Super Markets and D&W Fresh Market, in addition to dozens of pharmacies and fuel centers. Leveraging insights and solutions across its segments, SpartanNash offers a full suite of support services for independent grocers. For more information, visit spartannash.com.

CONTACT:
Adrienne Chance
SVP, Communications
SpartanNash
[email protected]

Cision View original content to download multimedia:https://www.prnewswire.com/news-releases/spartannash-donates-to-disaster-relief-efforts-in-maui-301905563.html

SOURCE SpartanNash

SpartanNash Announces Second Quarter Fiscal 2023 Results


Reaffirms Fiscal 2023 Adjusted EBITDA and Adjusted EPS Guidance; Updates Sales and Capital Outlook

Advances Long-Term Strategic Plan with Continued Transformation Initiatives

GRAND RAPIDS, Mich., Aug. 17, 2023 /PRNewswire/ — Food solutions company SpartanNash (the “Company”) (Nasdaq: SPTN) today reported financial results for its 12-week second quarter ended July 15, 2023.

Second Quarter Fiscal 2023 Highlights

  • Net sales of $2.31 billion, an increase of 1.7%, compared to $2.27 billion in the prior year quarter.
  • Retail comparable sales increased 3.9%, compared to the prior year quarter.
  • Net earnings of $19.5 million, compared to $5.1 million in the prior year quarter.
  • Adjusted EBITDA(1) of $66.1 million, compared to $61.8 million in the prior year quarter.
  • Cash generated from operating activities was $49.7 million during the first half of fiscal 2023 compared to $28.5 million in the first half of the prior year.
  • Returned $33.6 million to shareholders during the first half of fiscal 2023 through $18.5 million in share repurchases and $15.1 million in dividends.
  • Continued long-term plan transformation work by implementing new ways of working across the Company’s go-to-market functions, launching in the third quarter fiscal 2023. Expected run-rate cost savings of approximately $20 million by year-end.

(1)

A reconciliation of net earnings to adjusted EBITDA, a non-GAAP financial measure, is provided in Table 2 below.

“Our team delivered solid results in the first half of 2023, leveraging transformational initiatives for growth and value. We are encouraged by the success to date, but also believe there is a long runway of benefits that will help us achieve our long-term strategic plan,” said SpartanNash President and CEO Tony Sarsam. “We are now entering the next phase of our transformation, bolstering our go-to-market strategy and building on our Signature Strength of being the most customer-focused, innovative food solutions company. All of the elements of our long-term strategic plan differentiate SpartanNash as a growth-oriented organization, which further positions us to drive profitability and increase shareholder value.”

Second Quarter Consolidated Financial Results

Net sales increased $38.5 million, or 1.7%, to $2.31 billion from $2.27 billion in the prior year quarter. The year-over-year increase reflected sales growth in both the Wholesale and Retail segments, which were favorably impacted by inflation trends.

All of the elements of its long-term strategic plan differentiate SpartanNash as a growth-oriented organization.

Gross profit was $352.4 million, or 15.2% of net sales, compared to $354.2 million, or 15.6% of net sales, in the prior year quarter. The gross profit decline was driven by lower volumes while the gross profit rate decrease was driven by lower inflation-related price change benefits in the Wholesale segment compared to elevated levels in the prior year. The gross profit decline was partially offset by benefits realized from the merchandising transformation initiative and higher overall margin rates in the Retail segment. Last-in-first-out (“LIFO”) expense decreased $13.2 million, or 58 basis points, compared to the prior year quarter.

Reported operating expenses for the second quarter were $316.6 million, or 13.7% of net sales, compared to $341.9 million, or 15.0% of net sales, in the prior year quarter. The decrease in expenses as a percentage of sales was due primarily to a decline in incentive compensation expense compared to the prior year quarter, a reduction in the supply chain expense rates as a result of efficiencies realized from the Company’s supply chain transformation initiative, and lower restructuring and asset impairment charges.

The Company reported operating earnings of $35.8 million, an increase of $23.5 million, compared to $12.3 million in the prior year quarter. The increase was driven by the changes in net sales, gross profit, and operating expenses discussed above.

Interest expense of $9.3 million increased $4.8 million from the prior year quarter. Higher interest rates were driven by federal monetary policy tightening, resulting in a 350 basis point increase in the federal funds rate by the end of the second quarter compared to the prior year quarter, and accounted for $3.9 million of the increase in interest expense. Other income for the second quarter included a $0.8 million gain related to the amortization of a prior service credit of a previously terminated post-retirement plan.

The Company reported net earnings of $19.5 million, or $0.56 per diluted share, compared to $5.1 million, or $0.14 per diluted share in the prior year quarter. Adjusted earnings from continuing operations(2) for the second quarter were $22.4 million, or $0.65 per diluted share, compared to $24.2 million, or $0.66 per diluted share in the prior year quarter.

Adjusted EBITDA(1) increased $4.3 million to $66.1 million, compared to $61.8 million in the prior year quarter, due to the sales, gross profit and expense year-over-year trends mentioned above.

(2)

A reconciliation of net earnings to adjusted earnings from continuing operations, as well as per diluted share (“adjusted EPS”), a non-GAAP financial measure, is provided in Table 4 below.

Second Quarter Segment Financial Results

Wholesale

The Company’s supply chain network serves Wholesale customers that include independent and chain grocers, national retail brands, e-commerce platforms, and U.S. military commissaries and exchanges around the globe. The Company distributes products for every aisle in the grocery store, from fresh produce to household goods to its OwnBrands, which include the Our Family® portfolio of products.

Net sales for Wholesale increased $31.9 million, or 2.0%, to $1.63 billion from $1.60 billion in the prior year quarter. The growth in net sales was due primarily to the inflationary impact on pricing in the quarter partially offset by marketplace demand changes from a certain national account.

Reported operating earnings for Wholesale were $21.5 million, compared to $12.7 million in the prior year quarter. The increase in reported operating earnings was due to improved leverage of operating expenses, including lower incentive compensation, as well as efficiencies realized from the Company’s supply chain transformation initiative. The increase in reported operating earnings was partially offset by lower gross profit from cycling the prior year quarter’s inflation-related price change benefits and reduced volume in the current quarter. Adjusted EBITDA(1) decreased $1.9 million to $40.7 million from $42.6 million in the prior year quarter.

Retail

The Company operates a scaled regional Retail segment with 144 brick-and-mortar grocery stores, in addition to pharmacies and fuel centers.

Net sales for Retail increased $6.6 million, or 1.0%, to $679.0 million from $672.4 million in the prior year quarter. Retail comparable store sales grew 3.9% for the quarter, due primarily to the inflationary impact on pricing. Additionally, lower fuel prices in the quarter reduced reported net sales by 2.0%.

Reported operating earnings for Retail were $14.2 million, compared to a reported operating loss of $0.4 million in the prior year quarter. The improvement was due to lower incentive compensation, a higher gross profit rate, and reduced asset impairment and restructuring charges. This was partially offset by reduced volume, continued investment in store wage rates, and reduced pharmacy margins. Adjusted EBITDA(1) increased $6.2 million to $25.4 million from $19.2 million in the prior year quarter.

Balance Sheet and Cash Flow

Long-term debt and finance lease liabilities, including current maturities, increased $49.9 million during the first half of fiscal 2023. The Company’s net long-term debt(3) to adjusted EBITDA(1) ratio improved sequentially by 10 basis points to 2.2x, compared to the first quarter 2023. The Company’s liquidity remains strong, giving it flexibility to support its strategic plan.

Cash flows provided by operating activities for the first half of fiscal 2023 were $49.7 million, compared to $28.5 million in the first half of the prior year. The increase in cash flows compared to the prior year was due primarily to improvements in working capital.

Purchases of property and equipment were $60.8 million for the first half of fiscal 2023, compared to $46.4 million in the first half of the prior year, while capital expenditures and IT capital(4) totaled $63.5 million for the first half of fiscal 2023, compared to $49.6 million in the first half of the prior year.

During the first half of fiscal 2023, the Company paid $15.1 million in cash dividends, equal to $0.43 per common share. The Company also repurchased 765,194 shares of common stock for a total of $18.5 million during the first half of fiscal 2023, at an average price of $24.21 per share. In total, the Company returned $33.6 million to shareholders through the second quarter. As of July 15, 2023, $25.5 million remains available under the Company’s share repurchase program, which expires on February 22, 2027.

(3)

A reconciliation of long-term debt and finance lease obligations to net long-term debt, a non-GAAP financial measure, is provided in Table 5 below.

(4)

A reconciliation of purchases of property and equipment to capital expenditures and IT capital, a non-GAAP financial measure, is provided in Table 6 below.

Fiscal 2023 Outlook

Based upon the Company’s performance to date and the current outlook for the remainder of fiscal 2023, the Company has reaffirmed its previous guidance provided on February 23, 2023 with respect to adjusted EBITDA and adjusted EPS. The Company is updating its total net sales and capital expenditures and IT capital guidance to reflect current trends and market conditions. The following table provides the Company’s updated guidance for fiscal 2023:

Fiscal 2022

Previous Fiscal 2023 Outlook

Updated Fiscal 2023 Outlook

Actual

Low

High

Low

High

Total net sales (millions)

$

9,643

$

9,900

$

10,200

$

9,650

$

9,950

Adjusted EBITDA(1) (millions)

$

243

$

248

$

263

$

248

$

263

Adjusted EPS(2)

$

2.33

$

2.20

$

2.35

$

2.20

$

2.35

Capital expenditures and IT capital(4) (thousands)

$

102,097

$

130,000

$

145,000

$

130,000

$

140,000

Continuing to Execute Long-Term Plan

With meaningful progress underway with the Company’s supply chain transformation, merchandising transformation and marketing innovation initiatives, SpartanNash is now repositioning its go-to-market strategy. The strategy enhances customer centricity and is expected to deliver both effectiveness and efficiency. Over the past several months, the Company developed a refreshed go-to-market plan, which is being implemented in the third quarter fiscal 2023.

In connection with these changes, the Company expects to realize approximately $20 million in run-rate cost savings in late 2023, which was previously incorporated in the long-term strategic plan’s gross benefits communicated by the Company.

Conference Call & Supplemental Earnings Presentation

The Company will host a conference call to discuss its quarterly results with additional comments and details on Thursday, August 17, 2023, at 10:30 a.m. ET. There will also be a simultaneous, live webcast made available at SpartanNash’s website at www.spartannash.com/webcasts under the “Investor Relations” section and will remain archived on the Company’s website through Thursday, August 31, 2023.

A supplemental quarterly earnings presentation will also be available on the Company’s website at www.spartannash.com/investor-presentations.

About SpartanNash

SpartanNash (Nasdaq: SPTN) is a food solutions company that delivers the ingredients for a better life. Committed to fostering a People First culture, the SpartanNash family of Associates is 17,500 strong and growing. SpartanNash operates two complementary business segments – food wholesale and grocery retail. Its global supply chain network serves wholesale customers that include independent and chain grocers, national retail brands, e-commerce platforms, and U.S. military commissaries and exchanges. The Company distributes products for every aisle in the grocery store, from fresh produce to household goods to its OwnBrands, which include the Our Family® portfolio of products. On the retail side, SpartanNash operates 144 brick-and-mortar grocery stores, primarily under the banners of Family Fare, Martin’s Super Markets and D&W Fresh Market, in addition to dozens of pharmacies and fuel centers. Leveraging insights and solutions across its segments, SpartanNash offers a full suite of support services for independent grocers. For more information, visit spartannash.com.

Forward-Looking Statements

The matters discussed in this press release and in the Company’s website-accessible conference calls with analysts and investor presentations include “forward-looking statements” within the meaning of Section 27A of the Securities Act of 1933, as amended, and Section 21E of the Securities Exchange Act of 1934, as amended (“Exchange Act”), about the plans, strategies, objectives, goals or expectations of the Company. These forward-looking statements may be identifiable by words or phrases indicating that the Company or management “expects,” “projects,” “anticipates,” “plans,” “believes,” “intends,” or “estimates,” or that a particular occurrence or event “may,” “could,” “should,” “will” or “will likely” result, occur or be pursued or “continue” in the future, that the “outlook,” “trend,” “guidance” or “target” is toward a particular result or occurrence, that a development is an “opportunity,” “priority,” “strategy,” “focus,” that the Company is “positioned” for a particular result, or similarly stated expectations. Undue reliance should not be placed on these forward-looking statements, which speak only as of the date made. Forward-looking statements are necessarily based on estimates and assumptions that are inherently subject to significant business, economic and competitive uncertainties and contingencies, many of which, with respect to future business decisions, are subject to change. These uncertainties and contingencies may affect actual results and could cause actual results to differ materially. These risks and uncertainties include the Company’s ability to compete in an extremely competitive industry; the Company’s dependence on certain major customers; the Company’s ability to implement its growth strategy and transformation initiatives; changes in relationships with the Company’s vendor base and supply chain disruptions; vulnerability to decreases in the supply and increases in the price of raw materials and labor, manufacturing, distribution and other costs; macroeconomic uncertainty, including rising inflation, potential economic recession, and increasing interest rates; difficulty attracting and retaining well-qualified Associates and effectively managing increased labor costs; customers to whom the Company extends credit or for whom the Company guarantees loans or lease obligations may fail to repay the Company; not achieving the Company’s strategy of growth through acquisitions and encountering difficulties successfully integrating acquired businesses that may not realize the anticipated benefits; the Company’s ability to manage its private brand program for U.S. military commissaries, including the termination of the program or not achieving the desired results; disruptions to the Company’s information security network, including security breaches and cyber-attacks; changes in the geopolitical conditions, including the RussiaUkraine conflict; instances of security threats, severe weather conditions and natural disasters; climate change and an increased focus by stakeholders on environmental sustainability and corporate responsibility; impacts to the Company’s business and reputation due to an increasing focus on environmental, social and governance matters; disruptions associated with disease outbreaks, such as the COVID-19 pandemic; impairment charges for goodwill or other long-lived assets; the Company’s ability to successfully manage leadership transitions; interest rate fluctuations; the Company’s ability to service its debt and to comply with debt covenants; the Company’s level of indebtedness; changes in government regulations; changes in the military commissary system, including its supply chain, or in the level of governmental funding; product recalls and other product-related safety concerns; labor relations issues; cost increases related to multi-employer pension plans and other postretirement plans; and other risks and uncertainties listed under “Risk Factors” and “Management’s Discussion and Analysis of Financial Condition and Results of Operations” in the Company’s most recent Annual Report on Form 10-K and in subsequent filings with the Securities and Exchange Commission. Additional risks and uncertainties not currently known to the Company or that the Company currently believes are immaterial also may impair its business, operations, liquidity, financial condition and prospects. The Company undertakes no obligation to update or revise its forward-looking statements to reflect developments that occur or information obtained after the date of this press release.

SPARTANNASH COMPANY AND SUBSIDIARIES
CONDENSED CONSOLIDATED STATEMENTS OF EARNINGS
(Unaudited)

12 Weeks Ended

28 Weeks Ended

July 15,

July 16,

July 15,

July 16,

(In thousands, except per share amounts)

2023

2022

2023

2022

Net sales

$

2,312,394

$

2,273,890

$

5,219,788

$

5,037,548

Cost of sales

1,960,012

1,919,647

4,420,740

4,232,722

Gross profit

352,382

354,243

799,048

804,826

Operating expenses

Selling, general and administrative

318,795

338,867

736,991

761,049

Acquisition and integration

55

436

129

675

Restructuring and asset impairment, net

(2,254)

2,611

1,829

2,624

Total operating expenses

316,596

341,914

738,949

764,348

Operating earnings

35,786

12,329

60,099

40,478

Other expenses and (income)

Interest expense, net

9,349

4,528

20,938

8,713

Other, net

(685)

600

(1,724)

384

Total other expenses, net

8,664

5,128

19,214

9,097

Earnings before income taxes

27,122

7,201

40,885

31,381

Income tax expense

7,654

2,086

10,080

6,977

Net earnings

$

19,468

$

5,115

$

30,805

$

24,404

Net earnings per basic common share

$

0.57

$

0.14

$

0.90

$

0.69

Net earnings per diluted common share

$

0.56

$

0.14

$

0.88

$

0.67

Weighted average shares outstanding:

Basic

34,125

35,564

34,366

35,565

Diluted

34,641

36,528

35,116

36,470

SPARTANNASH COMPANY AND SUBSIDIARIES
CONDENSED CONSOLIDATED BALANCE SHEETS
(Unaudited)

July 15,

December 31,

(In thousands)

2023

2022

Assets

Current assets

Cash and cash equivalents

$

16,910

$

29,086

Accounts and notes receivable, net

426,186

404,016

Inventories, net

576,859

571,065

Prepaid expenses and other current assets

65,402

62,244

Total current assets

1,085,357

1,066,411

Property and equipment, net

609,236

610,220

Goodwill

182,160

182,160

Intangible assets, net

103,795

106,341

Operating lease assets

254,146

257,047

Other assets, net

92,217

84,382

Total assets

$

2,326,911

$

2,306,561

Liabilities and Shareholders Equity

Current liabilities

Accounts payable

$

500,044

$

487,215

Accrued payroll and benefits

61,344

103,048

Other accrued expenses

58,306

62,465

Current portion of operating lease liabilities

43,194

45,453

Current portion of long-term debt and finance lease liabilities

7,644

6,789

Total current liabilities

670,532

704,970

Long-term liabilities

Deferred income taxes

78,472

66,293

Operating lease liabilities

235,424

239,062

Other long-term liabilities

28,229

33,376

Long-term debt and finance lease liabilities

545,857

496,792

Total long-term liabilities

887,982

835,523

Commitments and contingencies

Shareholders equity

Common stock, voting, no par value; 100,000 shares

authorized; 34,618 and 35,079 shares outstanding

454,844

468,061

Preferred stock, no par value, 10,000 shares

authorized; no shares outstanding

Accumulated other comprehensive income

2,923

2,979

Retained earnings

310,630

295,028

Total shareholders equity

768,397

766,068

Total liabilities and shareholders equity

$

2,326,911

$

2,306,561

SPARTANNASH COMPANY AND SUBSIDIARIES
CONDENSED CONSOLIDATED STATEMENTS OF CASH FLOWS
(Unaudited)

28 Weeks Ended

(In thousands)

July 15, 2023

July 16, 2022

Cash flow activities

Net cash provided by operating activities

$

49,656

$

28,519

Net cash used in investing activities

(57,057)

(50,707)

Net cash (used in) provided by financing activities

(4,775)

32,739

Net (decrease) increase in cash and cash equivalents

(12,176)

10,551

Cash and cash equivalents at beginning of the period

29,086

10,666

Cash and cash equivalents at end of the period

$

16,910

$

21,217

SPARTANNASH COMPANY AND SUBSIDIARIES
SUPPLEMENTAL FINANCIAL DATA

Table 1: Sales and Operating Earnings (loss) by Segment
(Unaudited)

12 Weeks Ended

28 Weeks Ended

(In thousands)

July 15, 2023

July 16, 2022

July 15, 2023

July 16, 2022

Wholesale Segment:

Net sales

$

1,633,364

70.6

%

$

1,601,485

70.4

%

$

3,719,048

71.2

%

$

3,583,864

71.1

%

Operating earnings

21,542

12,697

47,867

40,819

Retail Segment:

Net sales

679,030

29.4

%

672,405

29.6

%

1,500,740

28.8

%

1,453,684

28.9

%

Operating earnings (loss)

14,244

(368)

12,232

(341)

Total:

Net sales

$

2,312,394

100.0

%

$

2,273,890

100.0

%

$

5,219,788

100.0

%

$

5,037,548

100.0

%

Operating earnings

35,786

12,329

60,099

40,478

Non-GAAP Financial Measures

In addition to reporting financial results in accordance with GAAP, the Company also provides information regarding adjusted operating earnings, adjusted earnings from continuing operations, as well as per diluted share (“adjusted EPS”), net long-term debt, capital expenditures and IT capital, and adjusted earnings before interest, taxes, depreciation and amortization (“adjusted EBITDA”). These are non-GAAP financial measures, as defined below, and are used by management to allocate resources, assess performance against its peers and evaluate overall performance. The Company believes these measures provide useful information for both management and its investors. The Company believes these non-GAAP measures are useful to investors because they provide additional understanding of the trends and special circumstances that affect its business. These measures provide useful supplemental information that helps investors to establish a basis for expected performance and the ability to evaluate actual results against that expectation. The measures, when considered in connection with GAAP results, can be used to assess the overall performance of the Company as well as assess the Company’s performance against its peers. These measures are also used as a basis for certain compensation programs sponsored by the Company. In addition, securities analysts, fund managers and other shareholders and stakeholders that communicate with the Company request its financial results in these adjusted formats.

Current year adjusted operating earnings, adjusted earnings from continuing operations, and adjusted EBITDA exclude, among other items, LIFO expense, organizational realignment, severance associated with cost reduction initiatives, a non-routine settlement related to a legal matter resulting from a previously closed operation that was resolved during the year and operating and non-operating costs associated with the postretirement plan amendment and settlement. Current year organizational realignment includes consulting costs associated with the Company’s change in its go-to-market strategy as part of its long-term plan, which relates to the reorganization of certain functions. Costs related to the postretirement plan amendment and settlement include non-operating expenses associated with amortization of the prior service credit related to the amendment of the retiree medical plan, which are excluded from adjusted earnings from continuing operations. Postretirement plan amendment and settlement costs also include operating expenses related to payroll taxes which are adjusted out of all non-GAAP financial measures. Prior year adjusted operating earnings, adjusted earnings from continuing operations, and adjusted EBITDA exclude, among other things, LIFO expense, costs related to shareholder activism, organizational realignment, operating and non-operating costs associated with the postretirement plan amendment and settlement, and severance associated with cost reduction initiatives. Costs related to shareholder activism include consulting, and other expenses incurred in relation to shareholder activism activities. Organizational realignment includes benefits for associates terminated as part of leadership transition plans, which do not meet the definition of reduction-in-force.

Each of these items are considered “non-operational” or “non-core” in nature.

The Company is unable to provide a full reconciliation of the GAAP to non-GAAP measures used in the Fiscal 2023 Outlook section of this press release without unreasonable effort because it is not possible to predict certain adjustment items with a reasonable degree of certainty since they are not yet known or quantifiable, and do not relate to the Company’s normal operating activities. These adjustments may include, among other items, restructuring and asset impairment activity, acquisition and integration costs, severance, costs related to the postretirement plan amendment and settlement, and organizational realignment costs, and the impact of adjustments to the LIFO inventory reserve. This information is dependent upon future events, which may be outside of the Company’s control and could have a significant impact on its GAAP financial results for fiscal 2023 or fiscal 2025, respectively.

Table 2: Reconciliation of Net Earnings to Adjusted Earnings Before Interest, Taxes, Depreciation and Amortization
(Adjusted EBITDA)
(A Non-GAAP Financial Measure)
(Unaudited)

12 Weeks Ended

28 Weeks Ended

(In thousands)

July 15, 2023

July 16, 2022

July 15, 2023

July 16, 2022

Net earnings

$

19,468

$

5,115

$

30,805

$

24,404

Income tax expense

7,654

2,086

10,080

6,977

Other expenses, net

8,664

5,128

19,214

9,097

Operating earnings

35,786

12,329

60,099

40,478

Adjustments:

LIFO expense

4,667

17,845

15,839

28,032

Depreciation and amortization

22,458

21,968

52,203

50,441

Acquisition and integration

55

436

129

675

Restructuring and asset impairment, net

(2,254)

2,611

1,829

2,624

Cloud computing amortization

1,076

869

2,426

1,769

Organizational realignment, net

2,029

252

2,029

1,271

Severance associated with cost reduction initiatives

(12)

495

272

741

Stock-based compensation

2,465

1,397

7,612

5,838

Stock warrant

353

481

960

1,154

Non-cash rent

(635)

(839)

(1,563)

(1,927)

Loss (gain) on disposal of assets

24

(54)

46

(131)

Legal settlement

900

Postretirement plan amendment and settlement

94

133

94

133

Costs related to shareholder activism

3,864

7,335

Adjusted EBITDA

$

66,106

$

61,787

$

142,875

$

138,433

12 Weeks Ended

28 Weeks Ended

(In thousands)

July 15, 2023

July 16, 2022

July 15, 2023

July 16, 2022

Wholesale:

Operating earnings

$

21,542

$

12,697

$

47,867

$

40,819

Adjustments:

LIFO expense

3,590

13,904

12,323

22,179

Depreciation and amortization

11,644

11,228

27,014

25,512

Acquisition and integration

55

124

Restructuring and asset impairment, net

1

(139)

981

(128)

Cloud computing amortization

725

579

1,665

1,228

Organizational realignment, net

1,266

156

1,266

793

Severance associated with cost reduction initiatives

(7)

495

257

619

Stock-based compensation

1,611

903

4,994

3,849

Stock warrant

353

481

960

1,154

Non-cash rent

(63)

(93)

(138)

(196)

Gain on disposal of assets

(45)

(72)

(35)

(158)

Legal settlement

900

Postretirement plan amendment and settlement

59

83

59

83

Costs related to shareholder activism

2,411

4,577

Adjusted EBITDA

$

40,731

$

42,633

$

98,237

$

100,331

Retail:

Operating earnings (loss)

$

14,244

$

(368)

$

12,232

$

(341)

Adjustments:

LIFO expense

1,077

3,941

3,516

5,853

Depreciation and amortization

10,814

10,740

25,189

24,929

Acquisition and integration

436

5

675

Restructuring and asset impairment, net

(2,255)

2,750

848

2,752

Cloud computing amortization

351

290

761

541

Organizational realignment, net

763

96

763

478

Severance associated with cost reduction initiatives

(5)

15

122

Stock-based compensation

854

494

2,618

1,989

Non-cash rent

(572)

(746)

(1,425)

(1,731)

Loss on disposal of assets

69

18

81

27

Postretirement plan amendment and settlement

35

50

35

50

Costs related to shareholder activism

1,453

2,758

Adjusted EBITDA

$

25,375

$

19,154

$

44,638

$

38,102

52 Weeks Ended

(In thousands)

2022

Net earnings

$

34,518

Income tax expense

12,397

Other expenses, net

21,629

Operating earnings

68,544

Adjustments:

LIFO expense

56,823

Depreciation and amortization

94,180

Acquisition and integration

343

Restructuring and asset impairment, net

805

Cloud computing amortization

3,650

Organizational realignment, net

1,859

Severance associated with cost reduction initiatives

831

Stock-based compensation

8,589

Stock warrant

2,158

Non-cash rent

(3,444)

Loss on disposal of assets

1,073

Postretirement plan amendment and settlement

133

Costs related to shareholder activism

7,335

Adjusted EBITDA

$

242,879

Notes: Adjusted Earnings Before Interest, Taxes, Depreciation and Amortization (“adjusted EBITDA”) is a non-GAAP operating financial measure that the Company defines as net earnings plus interest, discontinued operations, depreciation and amortization, and other non-cash items including share-based payments (equity awards measured in accordance with ASC 718, Stock Compensation, which include both stock-based compensation to employees and stock warrants issued to non-employees) and the LIFO provision, as well as adjustments for items that do not reflect the ongoing operating activities of the Company.

Adjusted EBITDA and adjusted EBITDA by segment are not measures of performance under GAAP and should not be considered as a substitute for net earnings, cash flows from operating activities and other income or cash flow statement data. The Company’s definitions of adjusted EBITDA and adjusted EBITDA by segment may not be identical to similarly titled measures reported by other companies.

Table 3: Reconciliation of Operating Earnings to Adjusted Operating Earnings
(A Non-GAAP Financial Measure)
(Unaudited)

12 Weeks Ended

28 Weeks Ended

(In thousands)

July 15, 2023

July 16, 2022

July 15, 2023

July 16, 2022

Operating earnings

$

35,786

$

12,329

$

60,099

$

40,478

Adjustments:

LIFO expense

4,667

17,845

15,839

28,032

Acquisition and integration

55

436

129

675

Restructuring and asset impairment, net

(2,254)

2,611

1,829

2,624

Organizational realignment, net

2,029

252

2,029

1,271

Severance associated with cost reduction initiatives

(12)

495

272

741

Legal settlement

900

Postretirement plan amendment and settlement

94

133

94

133

Costs related to shareholder activism

3,864

7,335

Adjusted operating earnings

$

40,365

$

37,965

$

81,191

$

81,289

Wholesale:

Operating earnings

$

21,542

$

12,697

$

47,867

$

40,819

Adjustments:

LIFO expense

3,590

13,904

12,323

22,179

Acquisition and integration

55

124

Restructuring and asset impairment, net

1

(139)

981

(128)

Organizational realignment, net

1,266

156

1,266

793

Severance associated with cost reduction initiatives

(7)

495

257

619

Legal settlement

900

Postretirement plan amendment and settlement

59

83

59

83

Costs related to shareholder activism

2,411

4,577

Adjusted operating earnings

$

26,506

$

29,607

$

63,777

$

68,942

Retail:

Operating earnings (loss)

$

14,244

$

(368)

$

12,232

$

(341)

Adjustments:

LIFO expense

1,077

3,941

3,516

5,853

Acquisition and integration

436

5

675

Restructuring and asset impairment, net

(2,255)

2,750

848

2,752

Organizational realignment, net

763

96

763

478

Severance associated with cost reduction initiatives

(5)

15

122

Postretirement plan amendment and settlement

35

50

35

50

Costs related to shareholder activism

1,453

2,758

Adjusted operating earnings

$

13,859

$

8,358

$

17,414

$

12,347

Notes: Adjusted operating earnings is a non-GAAP operating financial measure that the Company defines as operating earnings plus or minus adjustments for items that do not reflect the ongoing operating activities of the Company and costs associated with the closing of operational locations.

Adjusted operating earnings is not a measure of performance under GAAP and should not be considered as a substitute for operating earnings, and other income statement data. The Company’s definition of adjusted operating earnings may not be identical to similarly titled measures reported by other companies.

Table 4: Reconciliation of Net Earnings to
Adjusted Earnings from Continuing Operations, as well as per diluted share (“adjusted EPS”)
(A Non-GAAP Financial Measure)
(Unaudited)

12 Weeks Ended

July 15, 2023

July 16, 2022

per diluted

per diluted

(In thousands, except per share amounts)

Earnings

share

Earnings

share

Net earnings

$

19,468

$

0.56

$

5,115

$

0.14

Adjustments:

LIFO expense

4,667

17,845

Acquisition and integration

55

436

Restructuring and asset impairment, net

(2,254)

2,611

Organizational realignment, net

2,029

252

Severance associated with cost reduction initiatives

(12)

495

Postretirement plan amendment and settlement

(631)

745

Costs related to shareholder activism

3,864

Total adjustments

3,854

26,248

Income tax effect on adjustments (a)

(955)

(7,211)

Total adjustments, net of taxes

2,899

0.09*

19,037

0.52

Adjusted earnings from continuing operations

$

22,367

$

0.65

$

24,152

$

0.66

* Includes rounding

28 Weeks Ended

July 15, 2023

July 16, 2022

per diluted

per diluted

(In thousands, except per share amounts)

Earnings

share

Earnings

share

Net earnings

$

30,805

$

0.88

$

24,404

$

0.67

Adjustments:

LIFO expense

15,839

28,032

Acquisition and integration

129

675

Restructuring and asset impairment, net

1,829

2,624

Organizational realignment, net

2,029

1,271

Severance associated with cost reduction initiatives

272

741

Pension refund from annuity provider

(200)

Postretirement plan amendment and settlement

(1,649)

745

Legal settlement

900

Costs related to shareholder activism

7,335

Total adjustments

19,349

41,223

Income tax effect on adjustments (a)

(4,925)

(11,145)

Total adjustments, net of taxes

14,424

0.41

30,078

0.82

Adjusted earnings from continuing operations

$

45,229

$

1.29

$

54,482

$

1.49

52 Weeks Ended

2022

per diluted

(In thousands, except per share amounts)

Earnings

share

Net earnings

$

34,518

$

0.95

Adjustments:

LIFO expense

56,823

Acquisition and integration

343

Restructuring and asset impairment, net

805

Organizational realignment, net

1,859

Severance associated with cost reduction initiatives

831

Pension refund from annuity provider

(200)

Postretirement plan amendment and settlement

(776)

Costs related to shareholder activism

7,335

Write off of deferred financing costs

236

Total adjustments

67,256

Income tax effect on adjustments (a)

(17,083)

Total adjustments, net of taxes

50,173

1.38

Adjusted earnings from continuing operations

$

84,691

$

2.33

(a)

The income tax effect on adjustments is computed by applying the effective tax rate, before discrete tax items, to the total adjustments for the period.

Notes: Adjusted earnings from continuing operations, as well as per diluted share (“adjusted EPS”), is a non-GAAP operating financial measure that the Company defines as net earnings plus or minus adjustments for items that do not reflect the ongoing operating activities of the Company and costs associated with the closing of operational locations.

Adjusted earnings from continuing operations is not a measure of performance under GAAP and should not be considered as a substitute for net earnings, cash flows from operating activities and other income or cash flow statement data. The Company’s definition of adjusted earnings from continuing operations may not be identical to similarly titled measures reported by other companies.

Table 5: Reconciliation of Long-Term Debt and Finance Lease Obligations to Net Long-Term Debt
(A Non-GAAP Financial Measure)
(Unaudited)

(In thousands)

July 15, 2023

December 31, 2022

Current portion of long-term debt and finance lease liabilities

$

7,644

$

6,789

Long-term debt and finance lease liabilities

545,857

496,792

Total debt

553,501

503,581

Cash and cash equivalents

(16,910)

(29,086)

Net long-term debt

$

536,591

$

474,495

Notes: Net long-term debt is a non-GAAP financial measure that is defined as long-term debt and finance lease obligations plus current maturities of long-term debt and finance lease obligations less cash and cash equivalents. The Company believes both management and its investors find the information useful because it reflects the amount of long-term debt obligations that are not covered by available cash and temporary investments. Net long-term debt is not a substitute for GAAP financial measures and may differ from similarly titled measures of other companies.

Table 6: Reconciliation of Purchases of Property and Equipment to Capital Expenditures and IT Capital
(A Non-GAAP Financial Measure)
(Unaudited)

28 Weeks Ended

(In thousands)

July 15, 2023

July 16, 2022

Purchases of property and equipment

$

60,824

$

46,431

Plus:

Cloud computing spend

2,719

3,153

Capital expenditures and IT capital

$

63,543

$

49,584

52 Weeks Ended

(In thousands)

December 31, 2022

Purchases of property and equipment

$

97,280

Plus:

Cloud computing spend

4,817

Capital expenditures and IT capital

$

102,097

Notes: Capital expenditures and IT capital is a non-GAAP financial measure calculated by adding spending related to the development of cloud computing applications spend to capital expenditures, the most directly comparable GAAP measure. Cloud computing spend only includes costs incurred during the application development phase and does not include ongoing costs of hosting or maintenance associated with these applications, which are expensed as incurred. The Company believes it is a useful indicator of the Company’s investment in its facilities and systems as it transitions to more cloud-based IT systems. Capital expenditures and IT capital is not a substitute for GAAP financial measures and may differ from similarly titled measures of other companies.

INVESTOR CONTACT:
Kayleigh Campbell
Head of Investor Relations
[email protected]

MEDIA CONTACT:
Adrienne Chance
SVP, Communications
[email protected]

Cision View original content to download multimedia:https://www.prnewswire.com/news-releases/spartannash-announces-second-quarter-fiscal-2023-results-301903097.html

SOURCE SpartanNash

SpartanNash Celebrates Independent Grocers at 2023 Food Solutions Expo


The Company recognizes independent grocery customer sales, OwnBrands growth, and community partnerships through inaugural Vision Award

GRAND RAPIDS, Mich., Aug. 8, 2023 /PRNewswire/ — Food solutions company SpartanNash (the “Company”) (Nasdaq: SPTN) recently recognized its outstanding independent grocery customers’ achievements during its 2023 Food Solutions Expo. The Company honored 13 independent grocers with a 2023 Vision Award for year-over-year sales growth, growth in SpartanNash’s OwnBrands products, and community engagement initiatives.

“Our independent customers are integral to their local communities, and we take pride in providing them with the products, insights and services they need to grow their business,” said SpartanNash Executive Vice President and Chief Customer Officer David Sisk. “It was such an honor to celebrate our customers’ amazing achievements with them. Our success as a Company is tied to the success of our independent customers – when they win, our communities win, and our business wins.”

SpartanNash supports over 2,100 independent grocery customers nationwide with grocery products for every aisle. Additionally, the Company provides a variety of support services, including those related to marketing, merchandising, pharmacy, asset protection, financial and retail technology support.

The Vision Awards were presented at DeVos Place Convention Center in Grand Rapids, Mich. The winners include:

Top YOY Overall Sales Growth:

  • Fresh Encounter, Inc
  • Busch’s Fresh Food Market
  • Polly’s Country Market
  • Teal’s Market
  • Leevers Foods

Top OwnBrands YOY Growth:

  • Marketplace Foods
  • Busch’s Fresh Food Market
  • Cahoy’s General Store
  • Elba Butcher Shoppe
  • Polly’s Country Market

Our Family® Cares Community Partners:

  • Marketplace Foods
  • Jamestown Market
  • Fresh Foods
  • Randy’s Neighborhood Market
  • Dick’s Fresh Market

The SpartanNash Food Solutions Expo ran July 26July 27, at DeVos Place Convention Center in Grand Rapids, Mich. More than 2,000 attendees participated, including independent grocery customers, suppliers and SpartanNash Associates, to share upcoming trends, access incredible deals and network with industry professionals.

For more highlights from the 2023 SpartanNash Food Solutions Expo, see here.

About SpartanNash
SpartanNash (Nasdaq: SPTN) is a food solutions company that delivers the ingredients for a better life. Committed to fostering a People First culture, the SpartanNash family of Associates is 17,500 and growing. SpartanNash operates two complementary business segments – food wholesale and grocery retail. Its global supply chain network serves wholesale customers that include independent and chain grocers, national retail brands, e-commerce platforms, and U.S. military commissaries and exchanges. The Company distributes products for every aisle in the grocery store, from fresh produce to household goods to its OwnBrands, which include the Our Family® portfolio of products. On the retail side, SpartanNash operates 144 brick-and-mortar grocery stores, primarily under the banners of Family Fare, Martin’s Super Markets and D&W Fresh Market, in addition to dozens of pharmacies and fuel centers. Leveraging insights and solutions across its segments, SpartanNash offers a full suite of support services for independent grocers. For more information, visit spartannash.com.

CONTACT:
Adrienne Chance
SVP, Communications
SpartanNash
[email protected]

Cision View original content to download multimedia:https://www.prnewswire.com/news-releases/spartannash-celebrates-independent-grocers-at-2023-food-solutions-expo-301895763.html

SOURCE SpartanNash

SpartanNash to Webcast Second Quarter 2023 Earnings Conference Call


GRAND RAPIDS, Mich., Aug. 3, 2023 /PRNewswire/ — Food solutions company SpartanNash (the “Company”) (Nasdaq: SPTN) will announce its financial results before the stock market opens on Thursday, Aug. 17, 2023, for the 12-week second quarter ended July 15, 2023.

The Company will host a conference call to discuss its quarterly results with additional comments and details on Thursday, Aug. 17, 2023, at 10:30 a.m. ET. There will also be a simultaneous, live webcast made available at SpartanNash’s website at www.spartannash.com/webcasts under the “Investor Relations” section and will remain archived on the Company’s website through Thursday, Aug. 31, 2023.

A supplemental quarterly earnings presentation will also be available on the Company’s website at www.spartannash.com/investor-presentations.

About SpartanNash
SpartanNash (Nasdaq: SPTN) is a food solutions company that delivers the ingredients for a better life. Committed to fostering a People First culture, the SpartanNash family of Associates is 17,500 and growing. SpartanNash operates two complementary business segments – food wholesale and grocery retail. Its global supply chain network serves wholesale customers that include independent and chain grocers, national retail brands, e-commerce platforms, and U.S. military commissaries and exchanges. The Company distributes products for every aisle in the grocery store, from fresh produce to household goods to its OwnBrands, which include the Our Family® portfolio of products. On the retail side, SpartanNash operates 144 brick-and-mortar grocery stores, primarily under the banners of Family Fare, Martin’s Super Markets and D&W Fresh Market, in addition to dozens of pharmacies and fuel centers. Leveraging insights and solutions across its segments, SpartanNash offers a full suite of support services for independent grocers. For more information, visit spartannash.com.

INVESTOR CONTACT:
Kayleigh Campbell
Head of Investor Relations
[email protected]

MEDIA CONTACT:
Adrienne Chance
SVP, Communications
[email protected]

Cision View original content to download multimedia:https://www.prnewswire.com/news-releases/spartannash-to-webcast-second-quarter-2023-earnings-conference-call-301892174.html

SOURCE SpartanNash